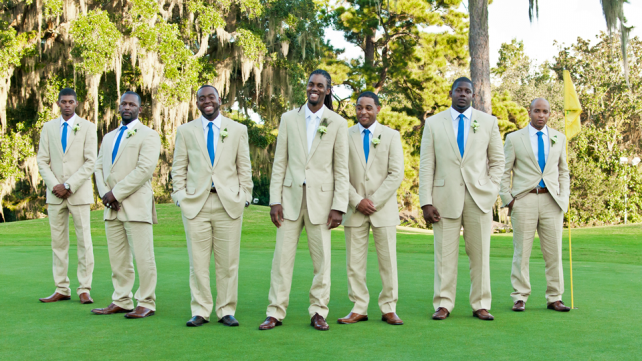
When do most people get married? Statistics regarding weddings in the United Satates collected from various by Sound Vision.
- 2.3 million couples wed every year in the US. That breaks down to nearly 6,200 weddings a day
- the average age of a bride in the US is 25.3
- average age of a groom is 26.9
- average number of guests invited to a wedding is 178
- one-third of those getting married each year have been married before
The money behind the marriage
- $72 billion per year is spent on weddings
- the average wedding budget is $20,000
- $1,016 is the average cost of wedding rings for the bride and groom
- traditionally, the father of the bride would pay for everything. Today, however, the bride and groom themselves pay for the wedding about 30 percent of the time; the bride's parents pay about 17 percent of the time. As for the rest of the time, costs are covered by different sources -- the bride and groom and one or both sets of parents, according to surveys by Bride's magazine.
- $19 billion per year is spent on wedding gift registries
- $8 billion per year is spent on honeymoons
- the average honeymoon budget is $3,657
- over 91 percent of all to-be-weds register for gifts. The couple receives gifts from an average of 200 guests
- most wedding guests spend between $70 and $100 on a gift
Timing of weddings
June is the most popular month for weddings, then August, followed by September and October
here's a monthly breakdown:
January 4.7%
February 7.0%
March 6.1%
April 7.4%
May 9.8%
June 10.8%
July 9.7%
August 10.2%
September 9.6%
October 9.4%
November 7.4%
December 7.8%
Where do weddings take place?
80 percent of weddings are performed in churches or synagogues
Honeymoons
- 99 percent of newlyweds take a honeymoon
- the average couple will spend three times more on their honeymoon than a regular vacation
- 40 percent of honeymooners will travel within the United States, about 60 percent will travel to a foreign country
- honeymoons usually last 7 to 9 days
- the most popular destinations are Las Vegas, Hawaii, the Caribbean, and Jamaica
- 35 percent of brides and grooms have a valid passport
Other Interesting Info
- the top wedding city in the world is Istanbul, Turkey with 166,000 for the year
- Las Vegas, Nevada is in second place with 114,000 weddings.
Sources for our statistics
US Census Bureau http://www.census.gov/Press-Release/www/2003/cb03ff02.html
The Knot (http://www.theknot.com/au_industrystats.shtml),
The Association for Wedding Professionals International (http://www.afwpi.com/wedstats)
Sellmoreweddings.com
Sellthebride.com (http://www.sellthebride.com/tipsstats.htm)
American Demographics
Bride's Millennium Report: Wedding Love & Money
Bride's magazine


Comments
Thanks for sharing
Thanks for sharing information. Your blog has always been a source of great tips.
Location
Excellent information you
Excellent information you have posted here. thanks !!
http://bmtpromotions.co.uk/branded-power-banks/
Location
This information gives great
This information gives great insight for my business www.signjunkies.etsy.com which specializes in wedding and special event dance floor decals.
Thank you for sharing this information.
Months with most weddings
You write "June is the most popular month for weddings, then August, followed by September and October".
But your data directly below contradicta your writings as May (9.8%) leads both Sept (9.6%) and October (9.4%)
Location
Great Wedding Stats to Consider!
Really, it's not just June weddings. Seems an average of 10% each month goes from May to September being almost even.
Wonderful.
Location
Great info. Where do you get your stats from? I found a cool site too calledhttp://wedwedwedding.comIt was very helpful in our learning process for wedding information as was your site.
Location
Very interesting stats...for the Bride and Groom looking to Save money on their wedding expenses, they should visit www.MakingMemoriesandMore.net they will find unique and affordable accessories for the wedding
Location
Wow, great article! I found the wedding timing particularly helpful! Kudos!Heather Rose, A Ceremony To Remember: www.heatherrose.info/weddings
Location
Wow, great article! I found the wedding timing particularly helpful! Kudos!Heather Rose, A Ceremony To Remember www.heatherrose.info/weddings
Location
Amazing stats!!! Good to know for my new EasyWeddingKit.com product.... All those brides need this!!!!
Location
Pages
Add new comment